Work
-
![]()
Heatmaps
A heatmap represents a one-dimensional or spatial distribution of values, often derived from discrete, sparse measurements that are transformed into a continuous field. This transformation—commonly achieved through methods such as kriging, kernel density estimation (KDE)
-
![]()
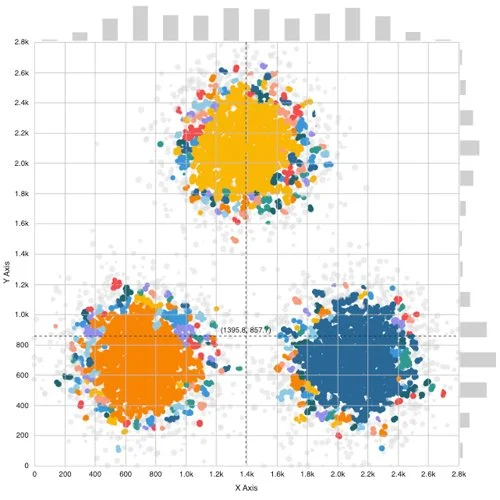
Scatter Plot Insights
Visualization is a powerful analytical tool that transforms complex data into actionable insights by enabling interactive exploration, intuitive pattern recognition, and precise statistical interpretation. A scatter-plot, specifically, is a fundamental visualization...
-
![]()
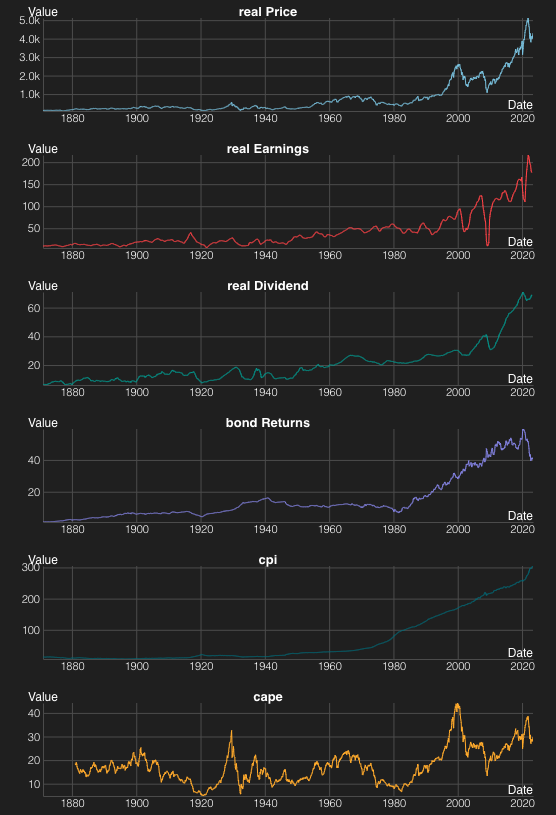
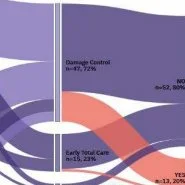
Time Series
Visualization is an essential analytical instrument for uncovering temporal patterns and relationships hidden within complex, multidimensional time-series data. Time-series visualization, particularly through the use of small multiples…
-
![]()
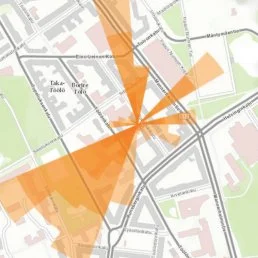
Putting Data on Maps
We put data on maps because location provides context dependent patterns: yet choices of boundaries, scales, and normalization can reveal and distort the same time, they mislead and clarify. Bottom line: every map must lie a little, in order to uncover the truths.
-
![]()
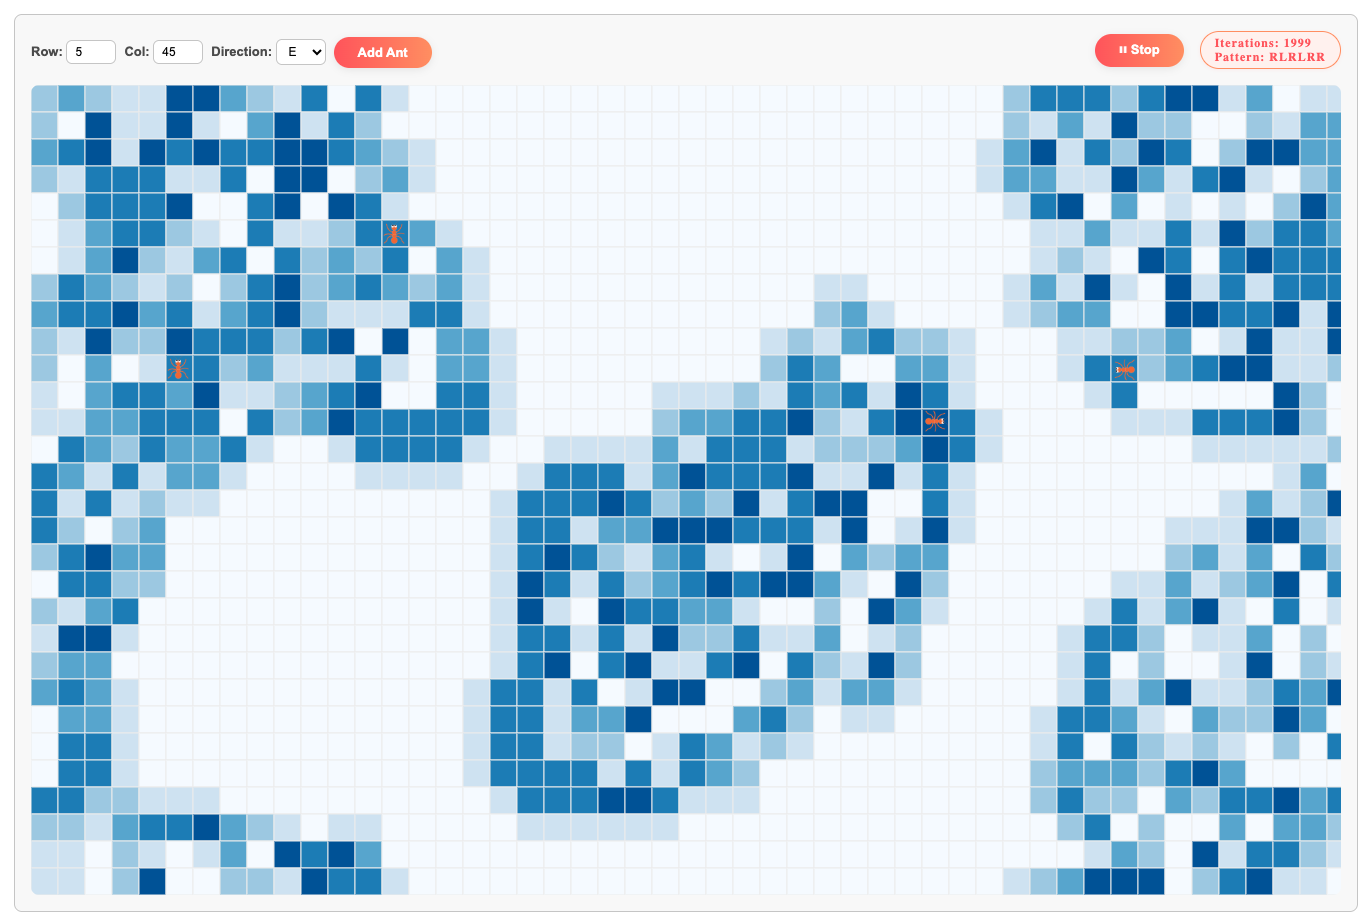
Pattern Visualization
Pattern visualization is about detecting, characterizing, and interpreting hidden structures in complex systems. Langton’s Ant is a perfect demonstrator: simple local rules produce what looks like chaos, until order suddenly emerges.
Visualization makes this transformation visible—turning a repeating pattern into an interpretable image. -
![]()
Street-Network Analysis
This project explores how the topology and connectedness of street networks differ across cities by extracting their road graphs from OpenStreetMap and visualizing them in a consistent, minimalistic style. By comparing patterns…
-
![]()
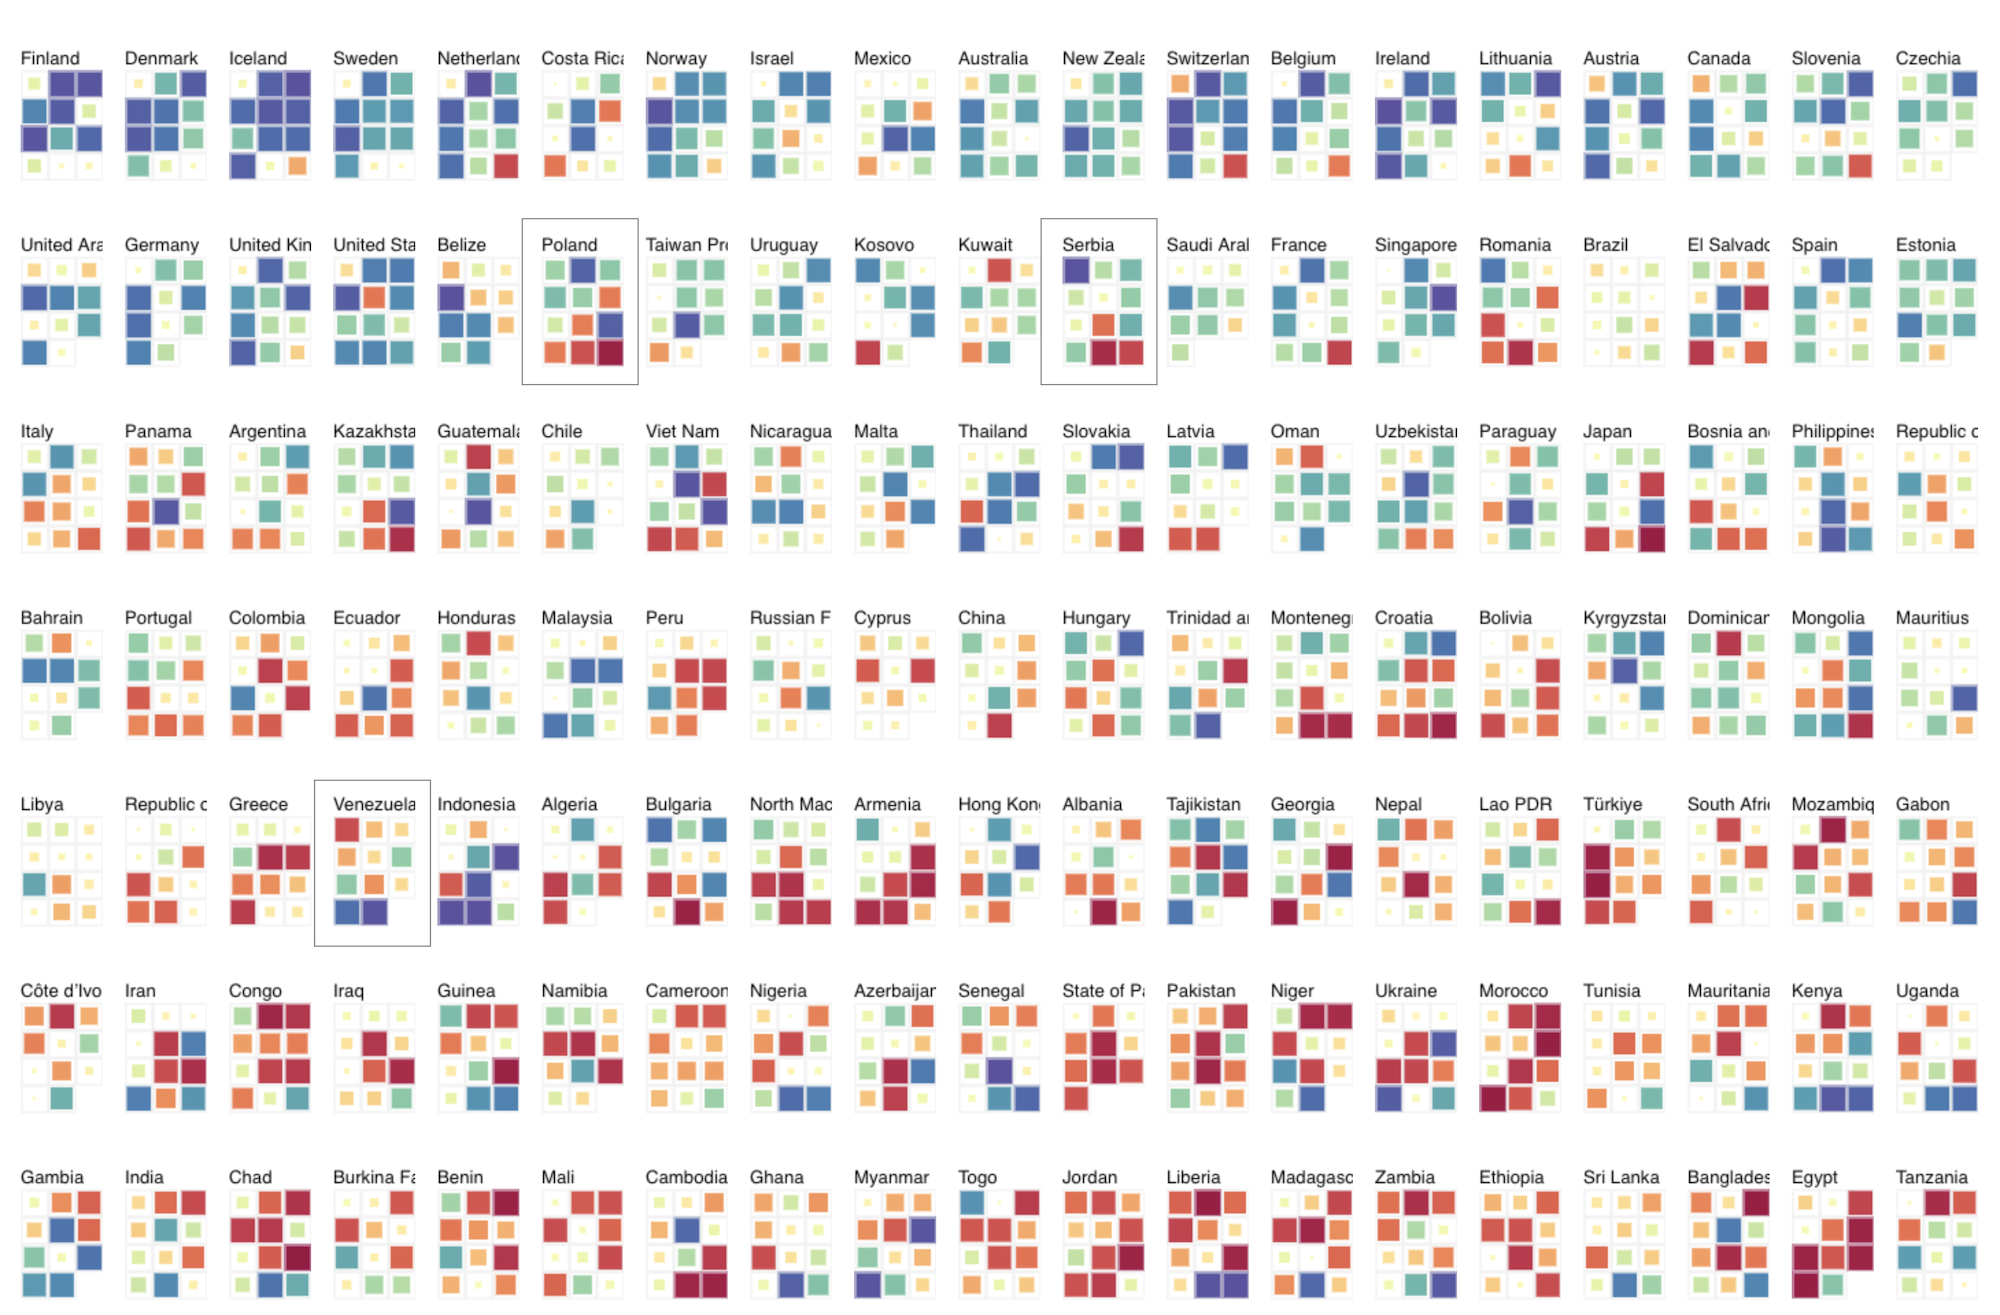
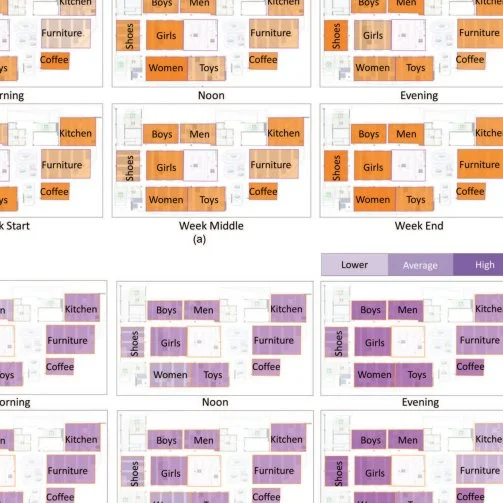
Dense Pixel Displays
Dense Pixel Displays are a powerful data visualization technique that maps each individual data value to a single pixel, using color to encode one property of the data. This approach enables the visualization of massive datasets…
-
![weather forecast]()
Interactive Dashboards - Weather
Dashboards are powerful tools for monitoring and communicating information, turning complex weather data into clear, actionable insights tailored to user needs. Even standard dashboards benefit from custom visualizations that highlight what matters most to their audience. For example, a wind rose visualization effectively conveys both wind speed and direction, helping users quickly grasp prevailing conditions relevant to their activities.


Book
Visual Analytics of Movement
Many important planning decisions in society and business depend on proper knowledge and a correct understanding of movement, be it in transportation, logistics, biology, or the life sciences. Today the widespread use of mobile phones and technologies like GPS and RFID provides an immense amount of data on location and movement. What is needed are new methods of visualization and algorithmic data analysis that are tightly integrated and complement each other to allow end-users and analysts to extract useful knowledge from these extremely large data volumes.
This is exactly the topic of this book. As the authors show, modern visual analytics techniques are ready to tackle the enormous challenges brought about by movement data, and the technology and software needed to exploit them are available today.

Patents
-
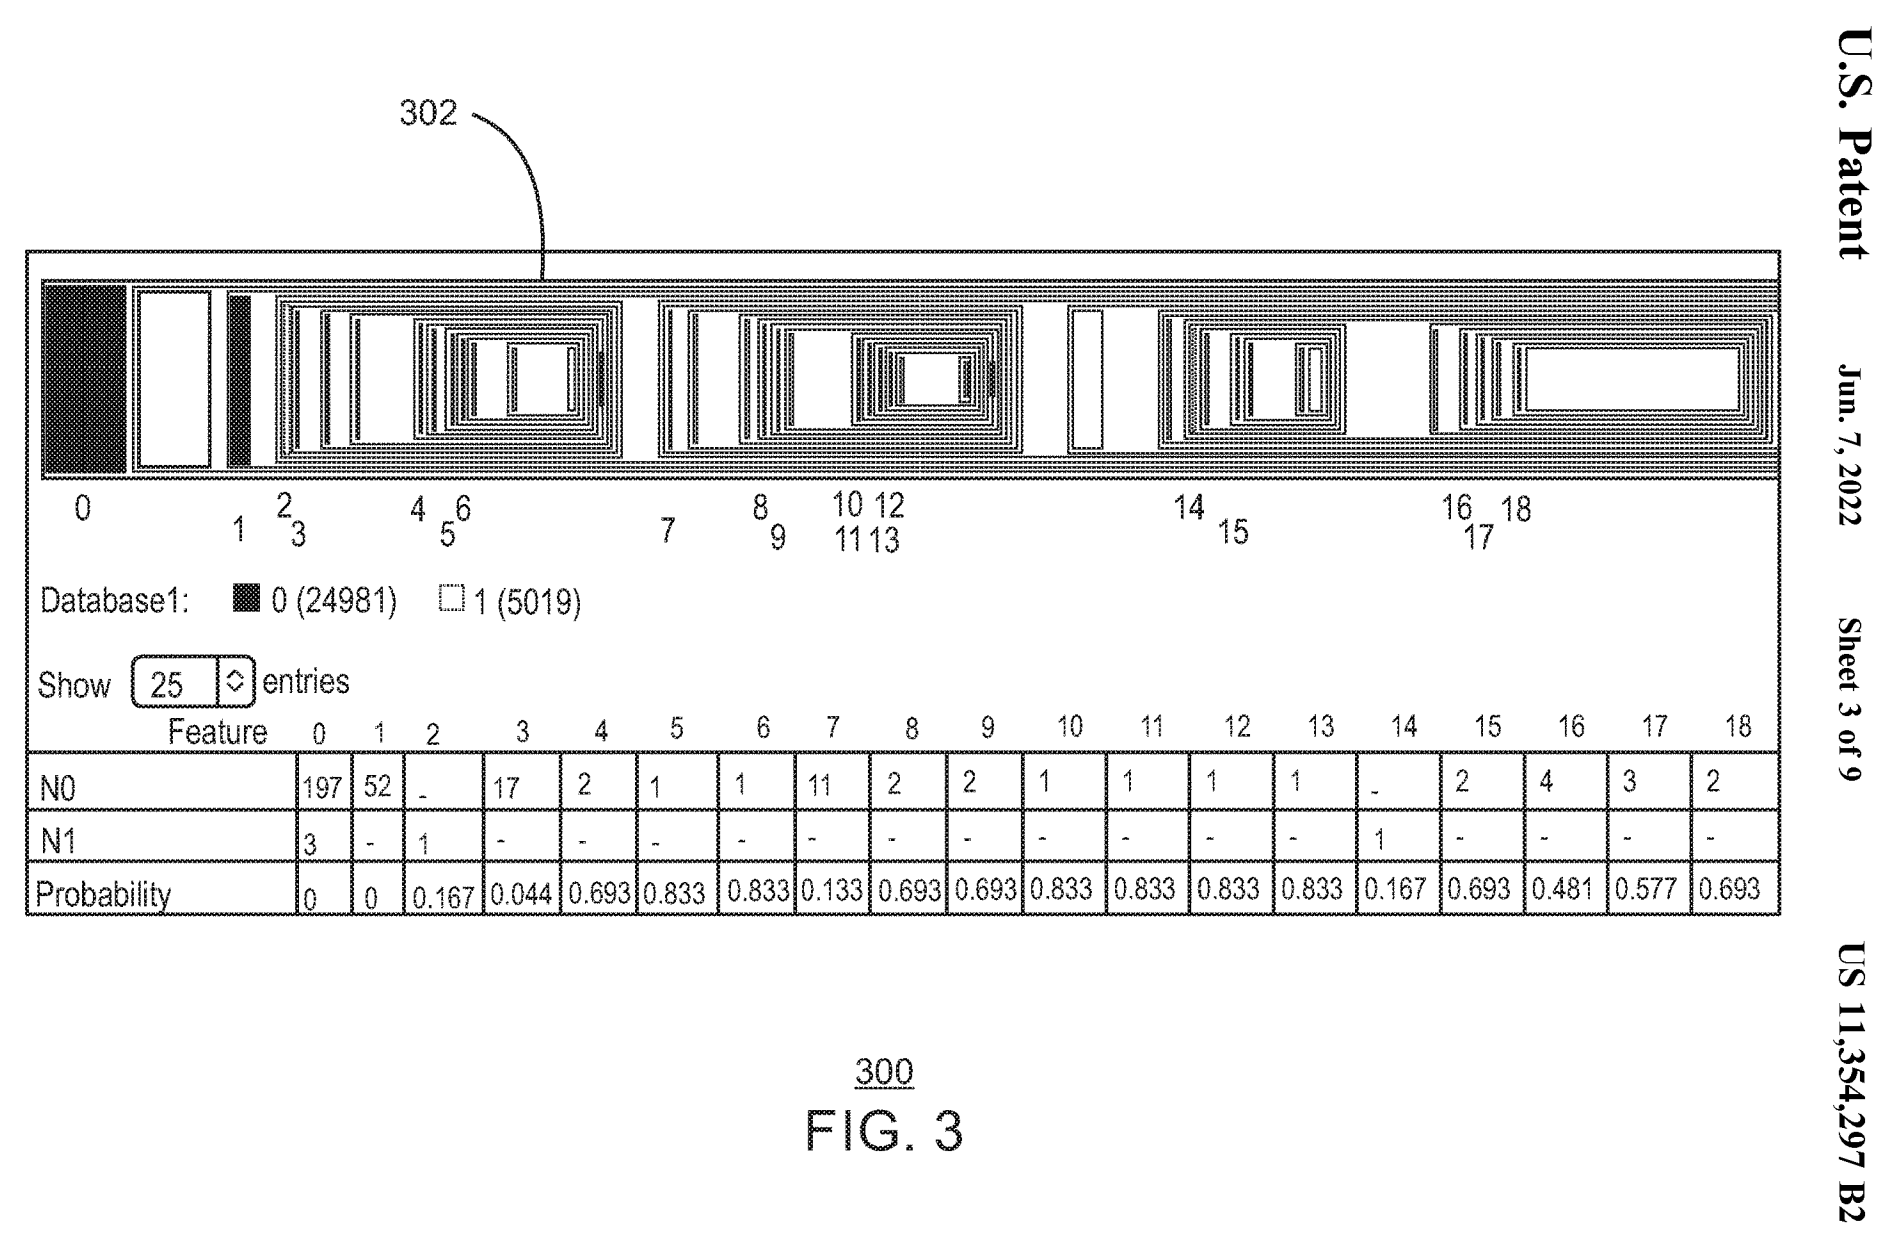
Detecting Positivity Violations in Multidimensional Data
US Patent US11354297B2
-
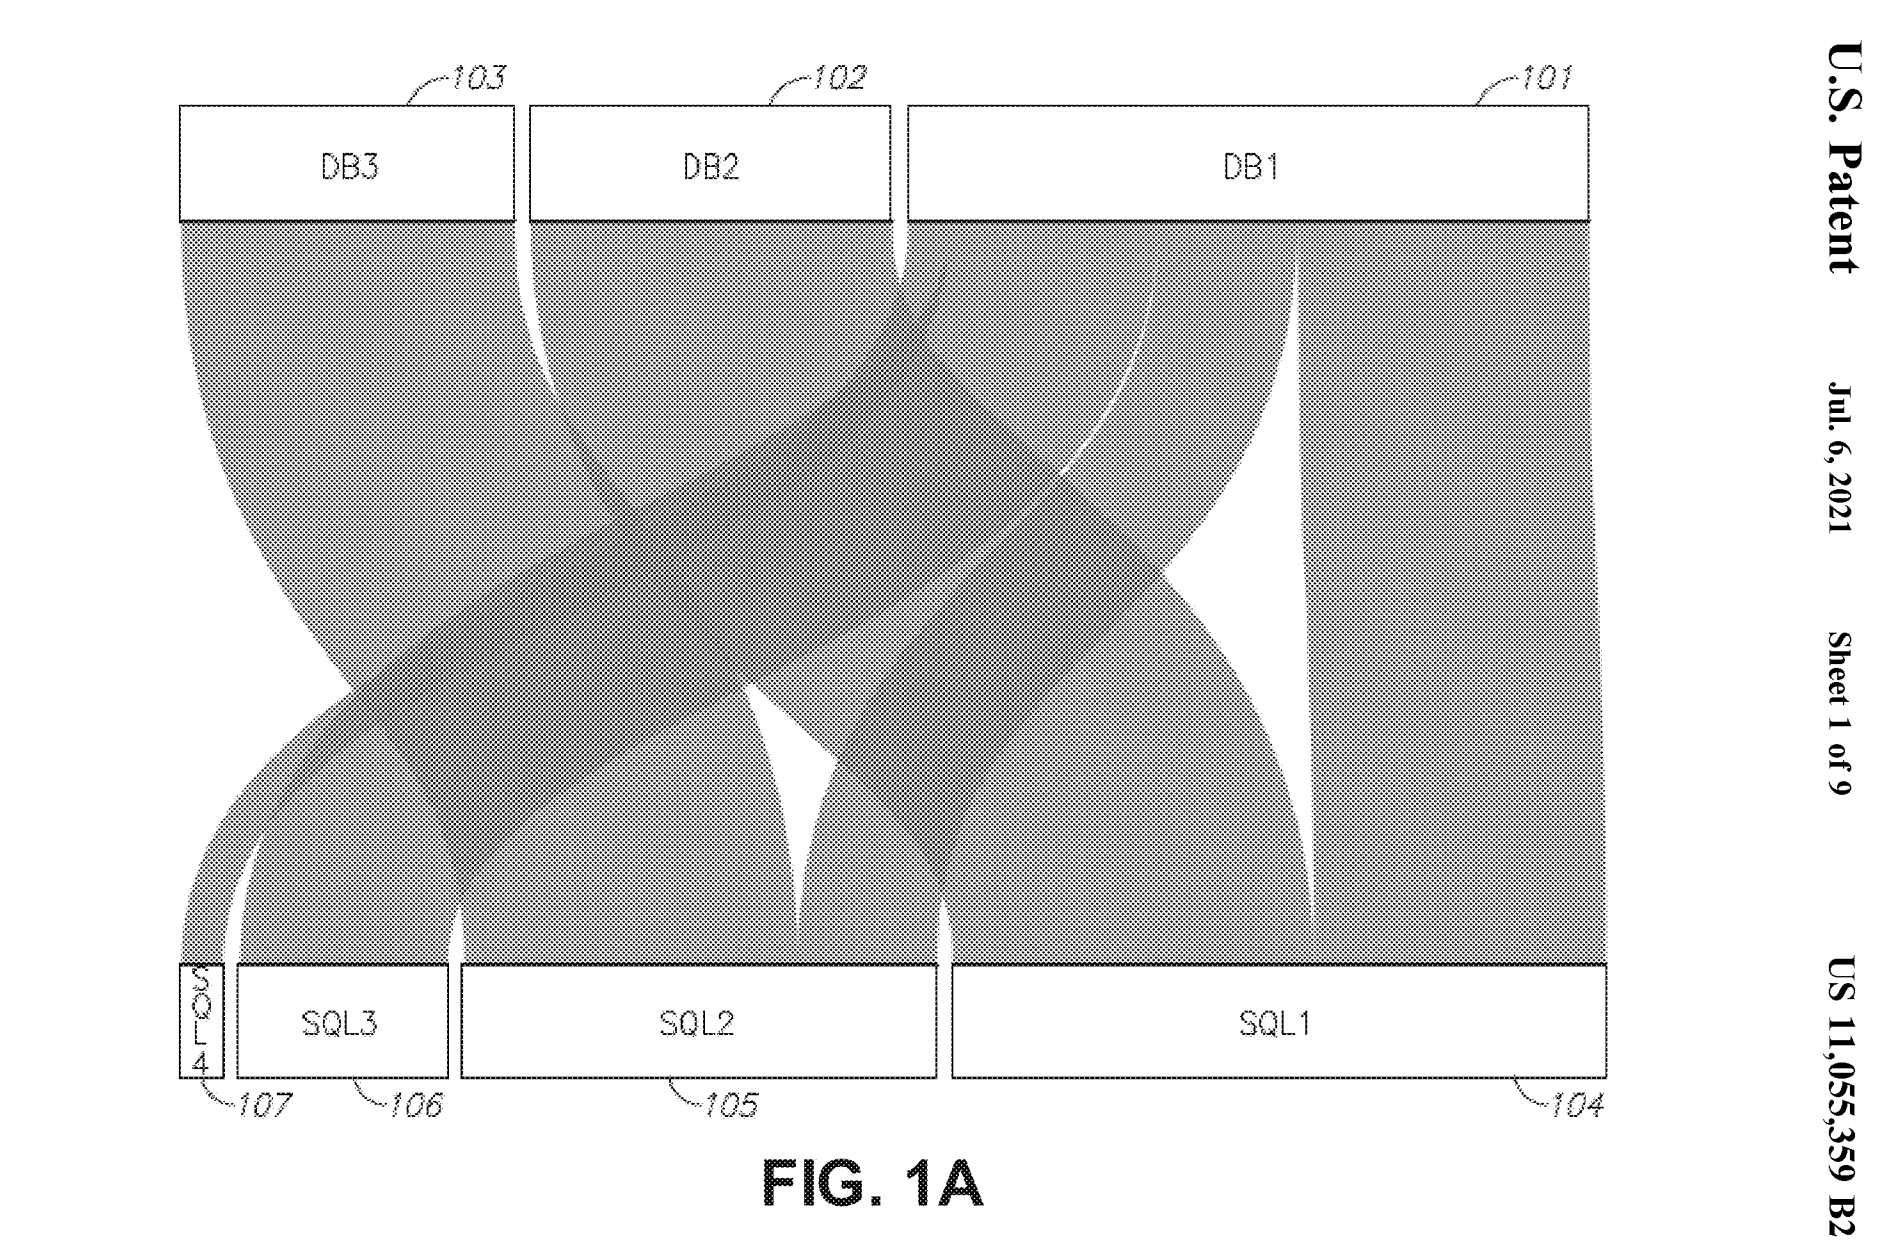
Hierarchical Objects Linkage Data Visualization
US Patent US11055359B2
-
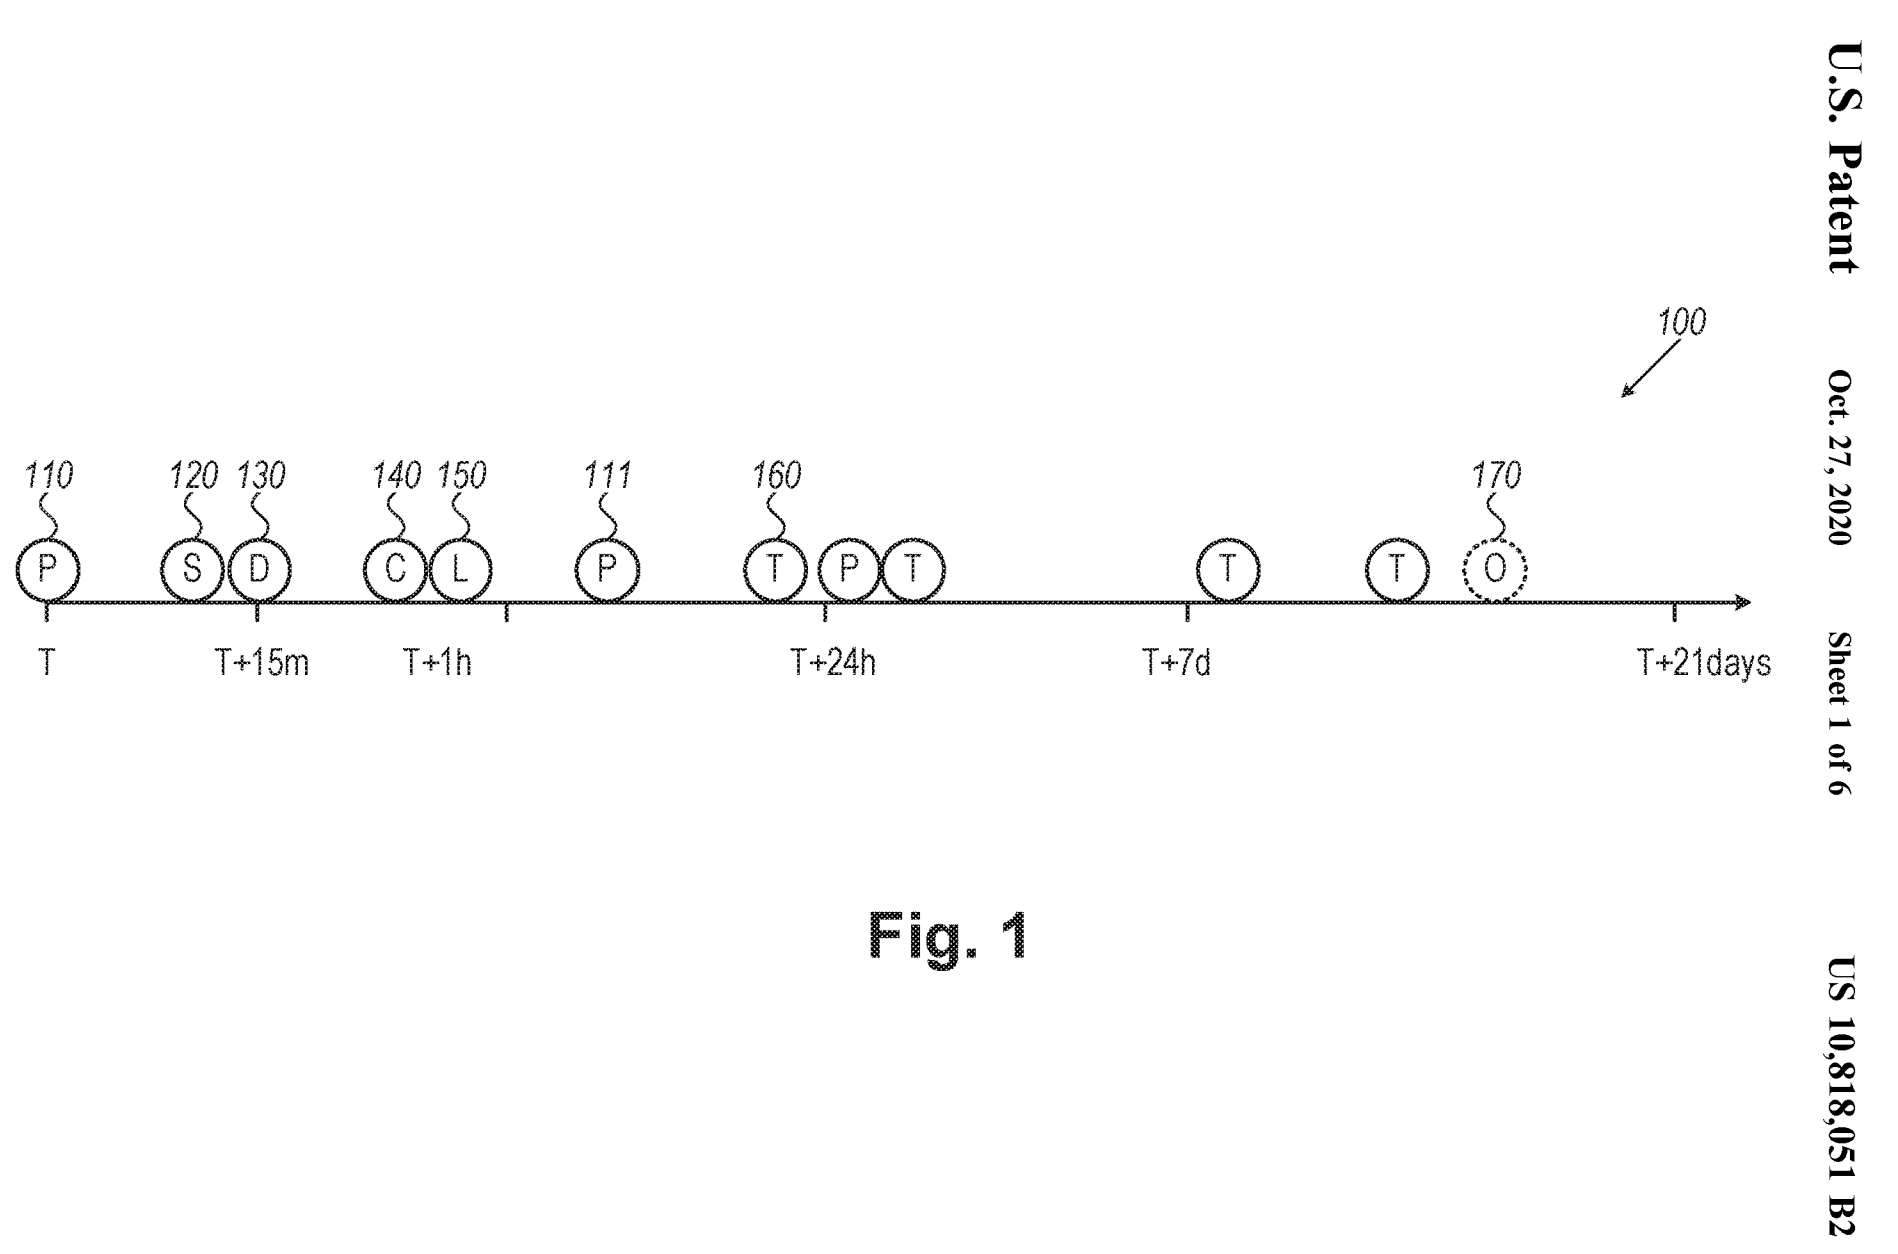
Relative Signature Traits of Cohorts
US Patent US10818051B2
-
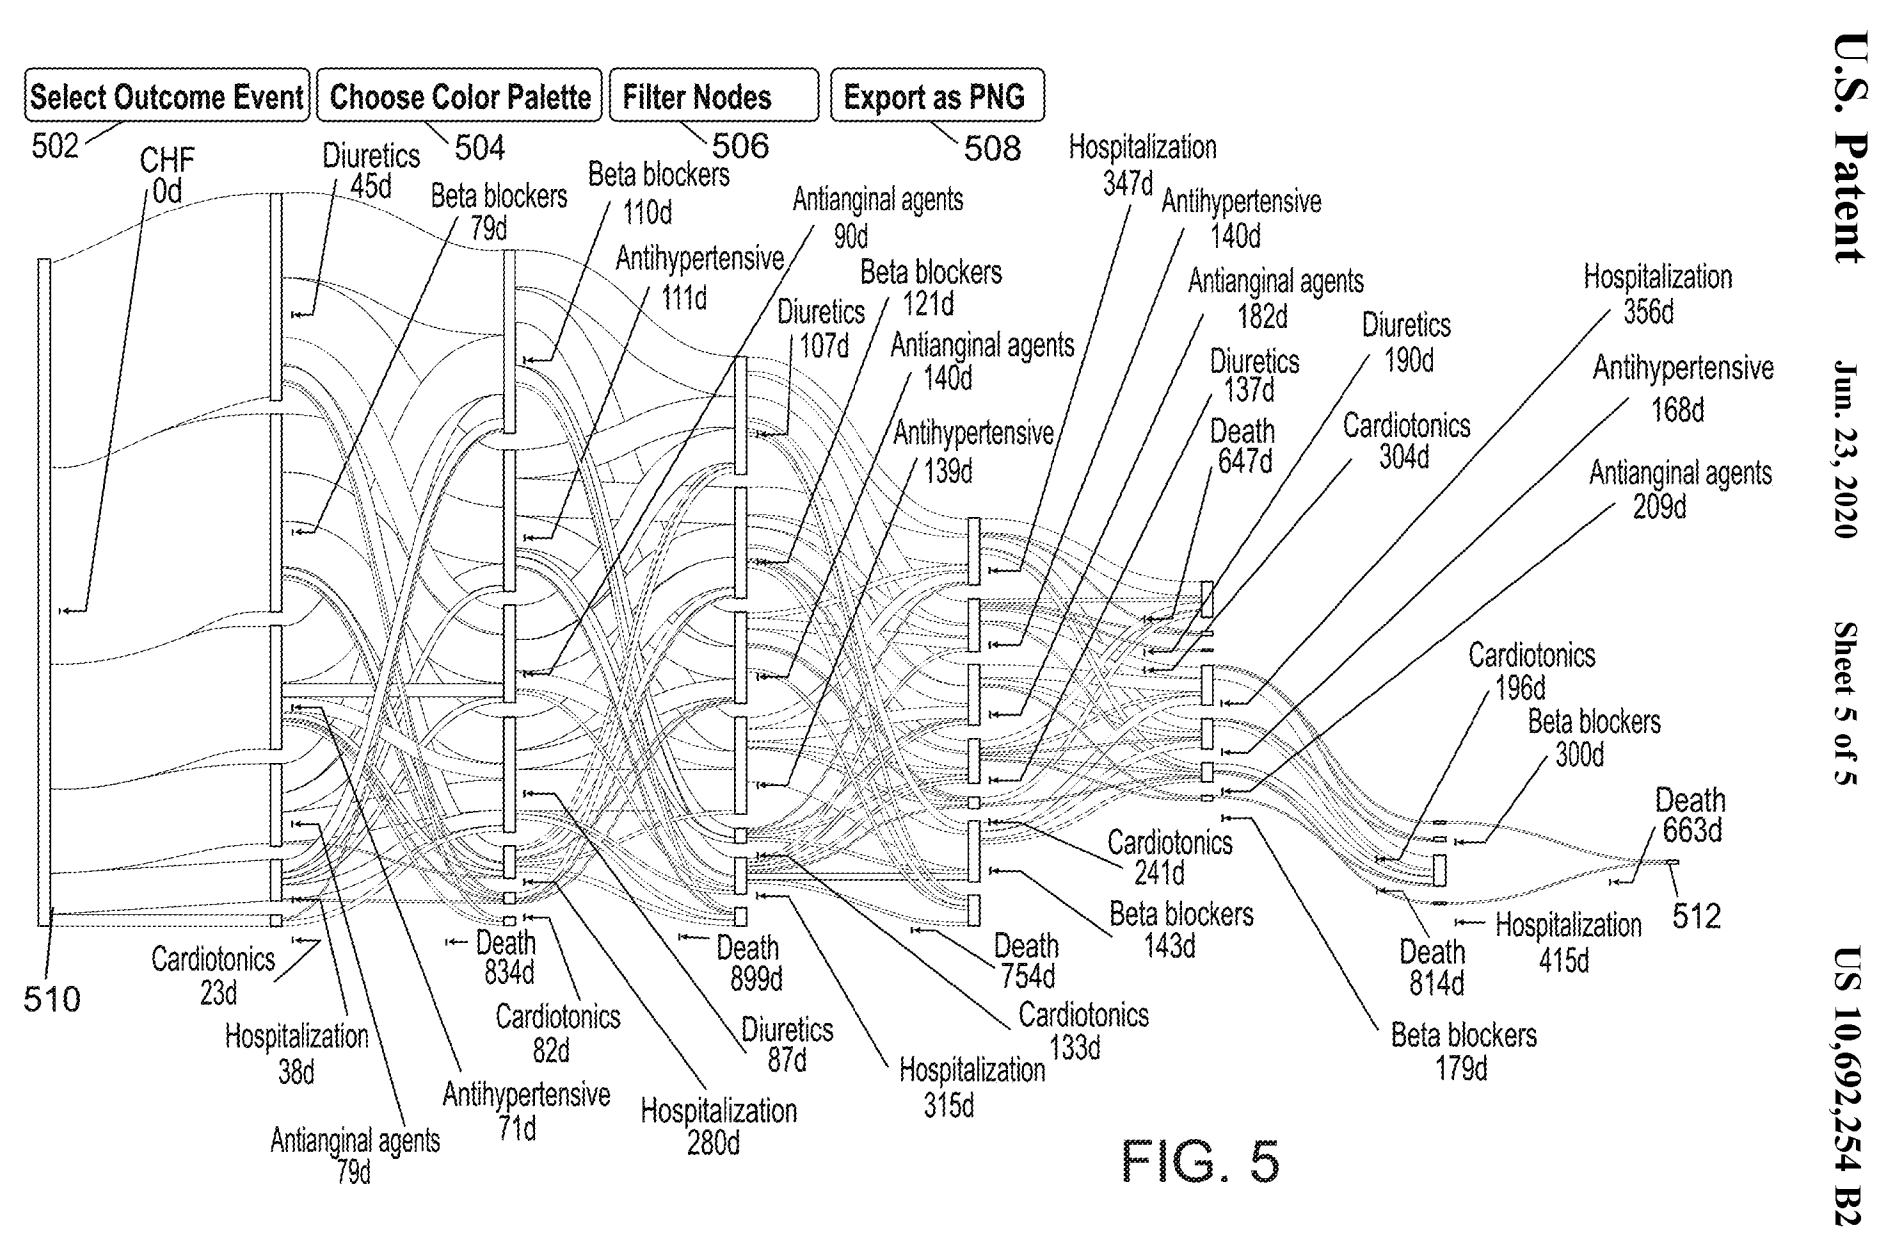
Systems and Methods for Constructing Clinical Pathways within a GUI
US Patent US10692254B2
Articles
-
Spatiotemporal Analysis of Sensor Logs Using Growth Ring Maps
-
Development of a Visual Analytics Tool for Polytrauma Patient
-
Visual Analytics for Movement Behavior in Traffic and Transportation
-
Understanding Customer Behavior Using Indoor Location Analysis and Visualization
-
A conceptual framework and taxonomy of techniques for analyzing movement

Guest Talks
-
2025, Feb.: Rafael
Introduction to Information Visualization, “Introduction to Visualization”.
-
2025, Jan.: Ben Gurion University of the Negev
Guest Lecture - “Visualization in Practice and Industry”.
-
2025, April - University of Haifa
Guest Lecture - Information Systems Dept. “Spatial and Spatiotemporal Information Visualization
-
2024, May: Meta
Customer meetup, “How to solve problems with data visualization”.
-
2022, Dec.: Meta
Data Science department, “Introduction to Information Visualization”.
Peter Bak
-
I am an information visualization expert with over 15 years of experience in the health, transportation, and defense industries. I have a strong track record of scientific publications and patents. I specialize in designing interactive visualizations that serve as a powerful interface between domain experts and their data. These solutions excel at uncovering hidden patterns and driving data-driven decision-making, particularly when dealing with large, complex, or multimodal datasets that traditional methods often struggle to handle.
My focus is on delivering innovative, web-based visualization tools as proof-of-concepts, enabling faster integration into existing systems and environments. I excel in client-facing interactions, data analysis, and the design and implementation of these tools, maximizing value for clients by offering comprehensive and adaptable solutions.
My background:
- Freelancing as an expert in visual analytics, since 2023 - on going
- Teaching Fellow a the Technion and lecturer at local universities, since 2010 - on going
- Head of information visualization at K Health R&D, AI-startup , 2020-2024
- Senior research staff member at IBM-Research and Watson Health, 2010-2020
- Post Doctoral fellow at the University of Konstanz / Germany, 2007-2010
- PhD in Human Factors Engineering at the Ben Gurion Univ. of the Negev / Israel, 2002-2007
- MBA (Magister der Wirtschaftsinformatik) at the J. Kepler Univ. Linz / Austria.To learn how I work and what I do and deliver, see the FAQs.