Dense pixel displays
Dense Pixel Displays are a powerful data visualization technique that maps each individual data value to a single pixel, using color to encode one property of the data. This approach enables the visualization of massive datasets—potentially up to a million data points—within the confines of a standard display, making it highly scalable for modern analytical tasks . By eliminating white space and preventing overlap, dense pixel displays ensure that every data point is represented without obstruction, facilitating clear and immediate visual comparisons . Each dimension in the dataset can be assigned a consistent color scale, allowing for intuitive recognition of patterns, trends, and anomalies across multiple variables. This method is particularly effective for comparative analysis, as it allows users to quickly discern differences and similarities within large and complex datasets.
Check out the examples below. If you’re curious how I work and what I deliver, the FAQs explains it.
A pixel-based comparison of happiness across countries, where each square encodes a single property such as generosity, GDP per capita, or social support. One view groups data by country, while the other rearranges by variable—highlighting differences, similarities, and outliers across nations and metrics in a highly scalable, with comparison-friendly interaction.
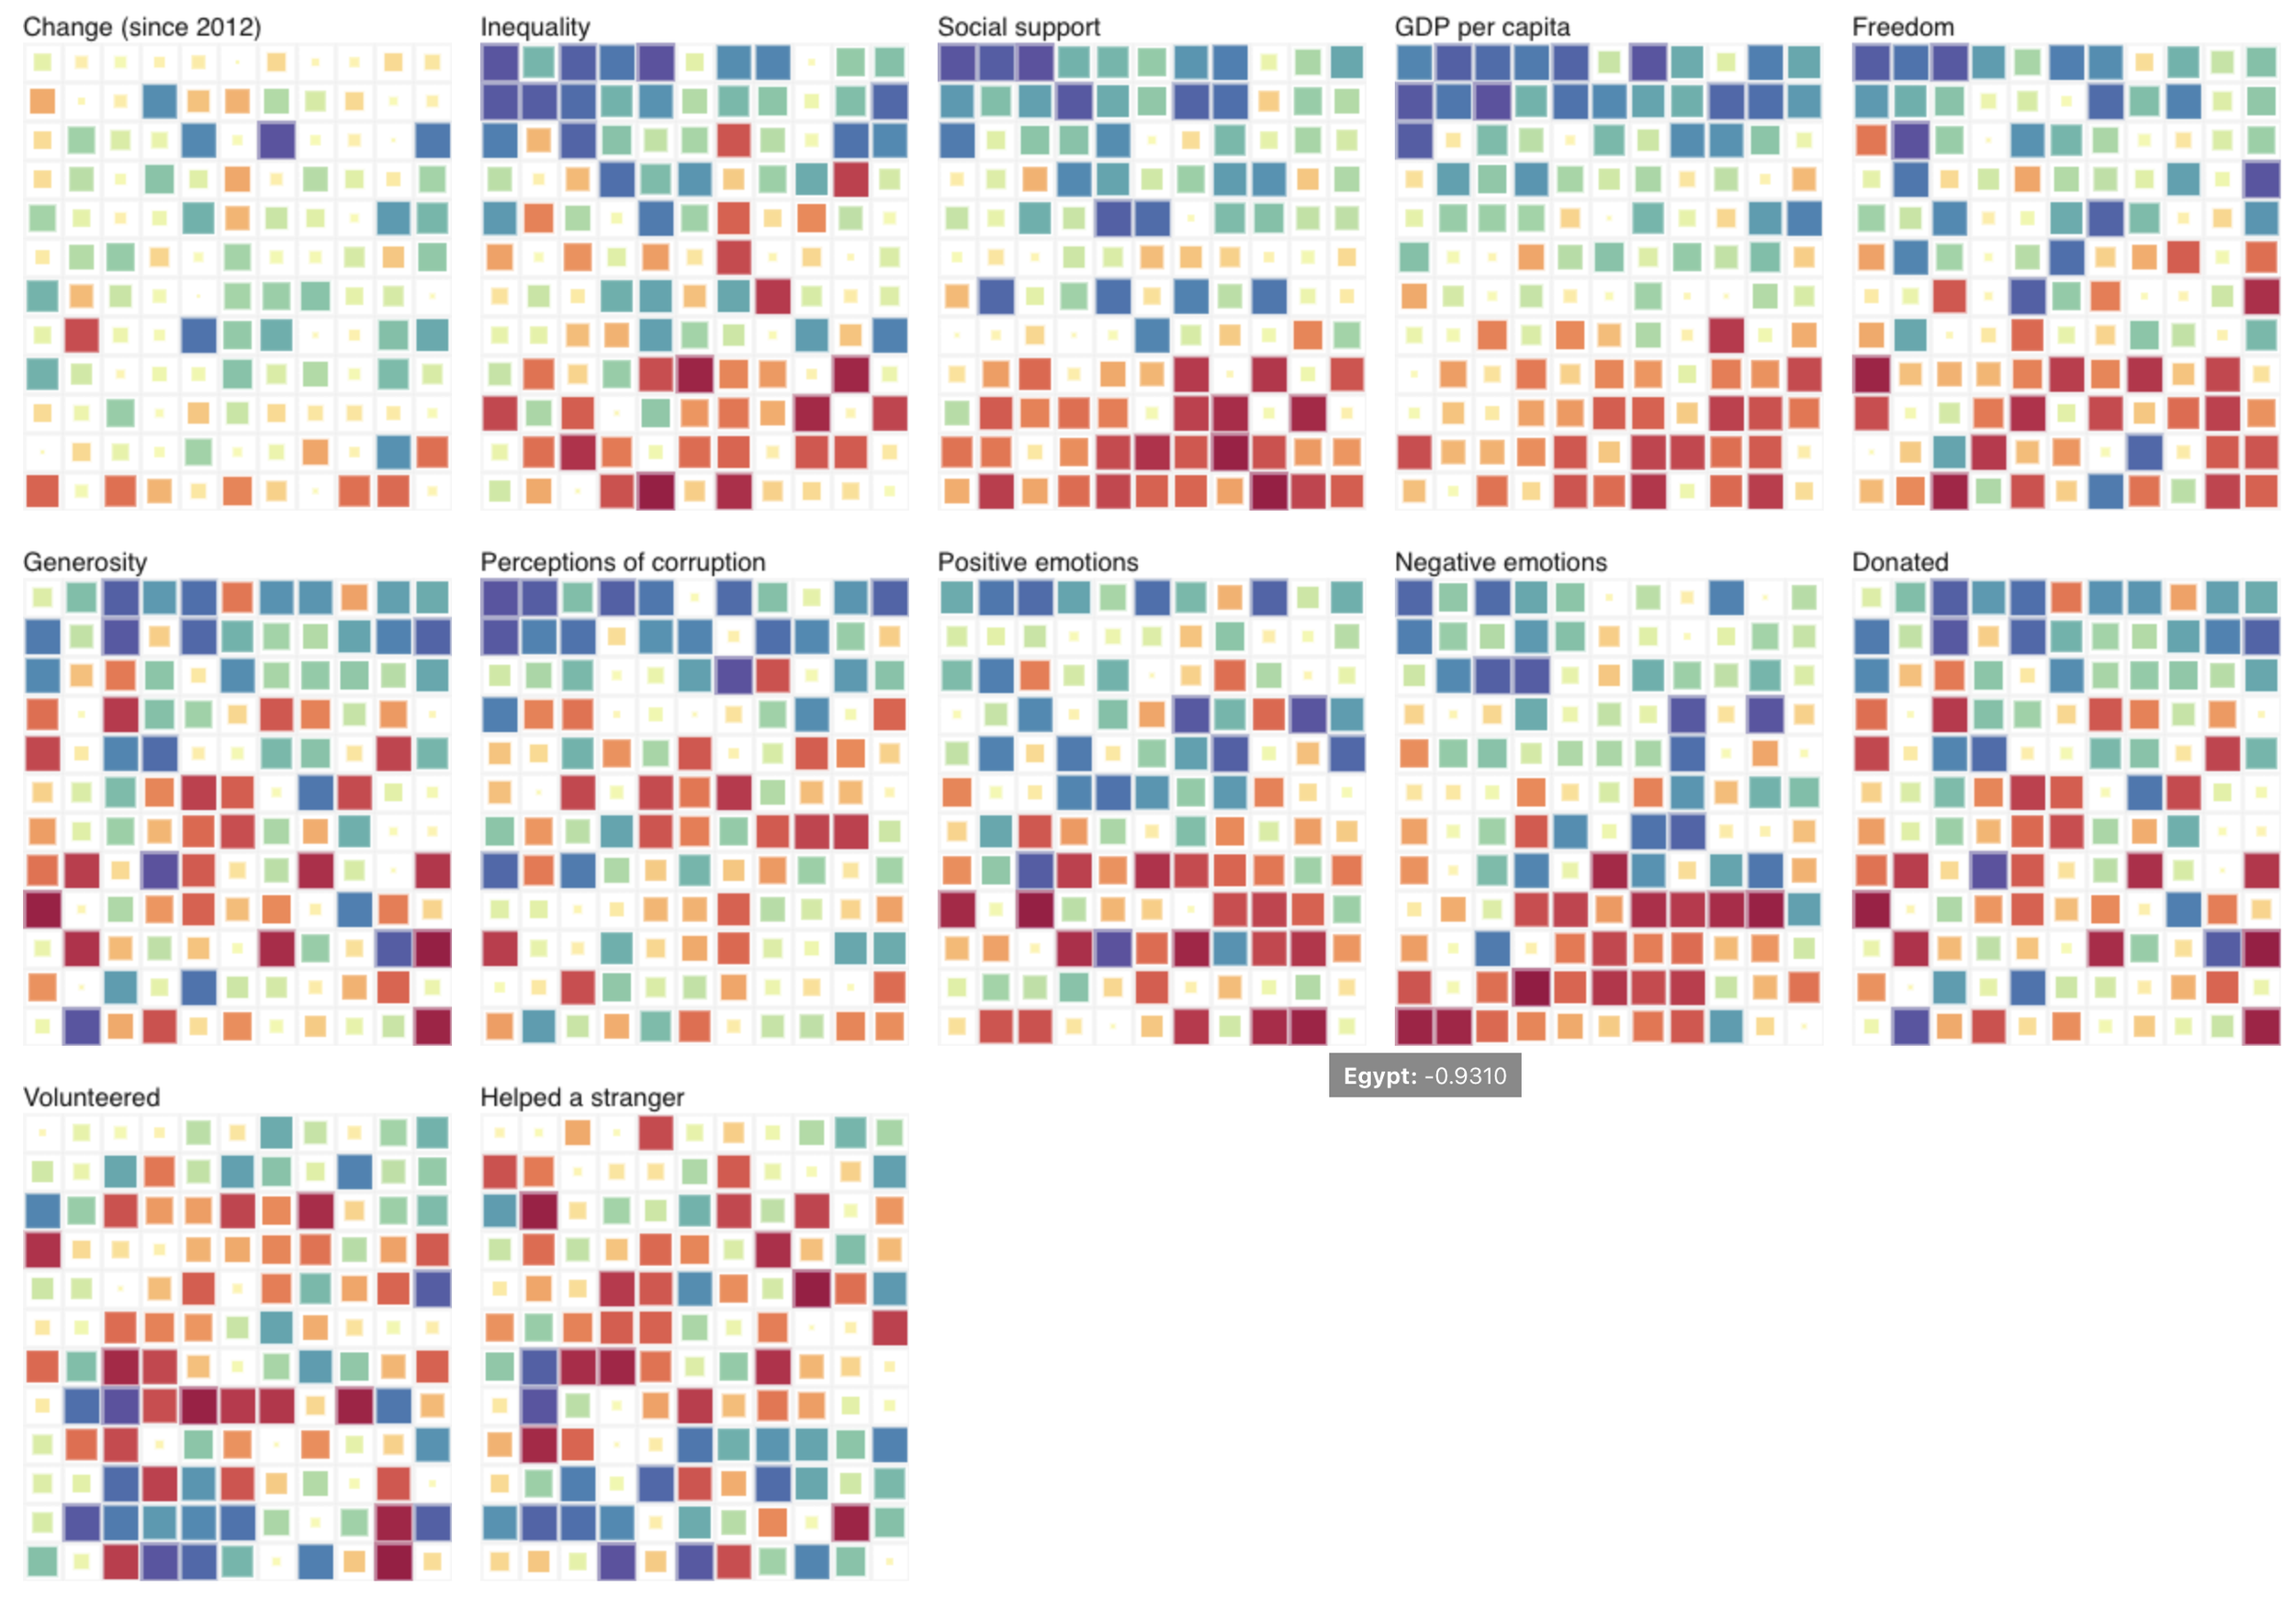
A grid-based overview of happiness indicators, sorted by each property, highlights global patterns at a glance. Countries with high inequality or low freedom cluster visually, while metrics like generosity or emotional expression reveal complex, scattered distributions. The layout supports quick identification of outliers—such as Egypt very low in “Positive emotions”—and facilitates cross-variable comparison through a dense pixel display approach.

A pixel-based view of country-level happiness attributes reveals striking contrasts: Poland exhibits high internal diversity across its indicators, while Serbia and Venezuela stand out as opposites—Serbia leaning strongly toward positive metrics, Venezuela toward negative ones. The compact format enables rapid visual comparison across nations.