Street network analysis
This project explores how the topology and connectedness of street networks differ across cities by extracting their road graphs from OpenStreetMap and visualizing them in a consistent, minimalistic style. By comparing patterns of arterial routes, local grids, cul-de-sacs, and peripheral connections, the work aims to reveal how geography, planning history, and urban growth shape each city’s circulation structure. It is very much a work in progress: the goal is not only to create visually striking maps, but to build towards more systematic, graph-based comparisons of connectivity, redundancy, and accessibility between urban areas. Semantic zooming is used to expose different structural layers of the network as scale changes, rather than merely enlarging geometry. At broader scales the visualization highlights global connectivity backbones, while finer zoom levels progressively reveal local street structure and intersection density.
Check out the examples below. If you’re curious how I work and what I deliver, the FAQs explains it.

Manhattan, New York – A highly regular rectilinear grid with strong longitudinal and cross-town corridors, producing extremely high local connectivity and clear hierarchies between primary avenues and secondary streets.
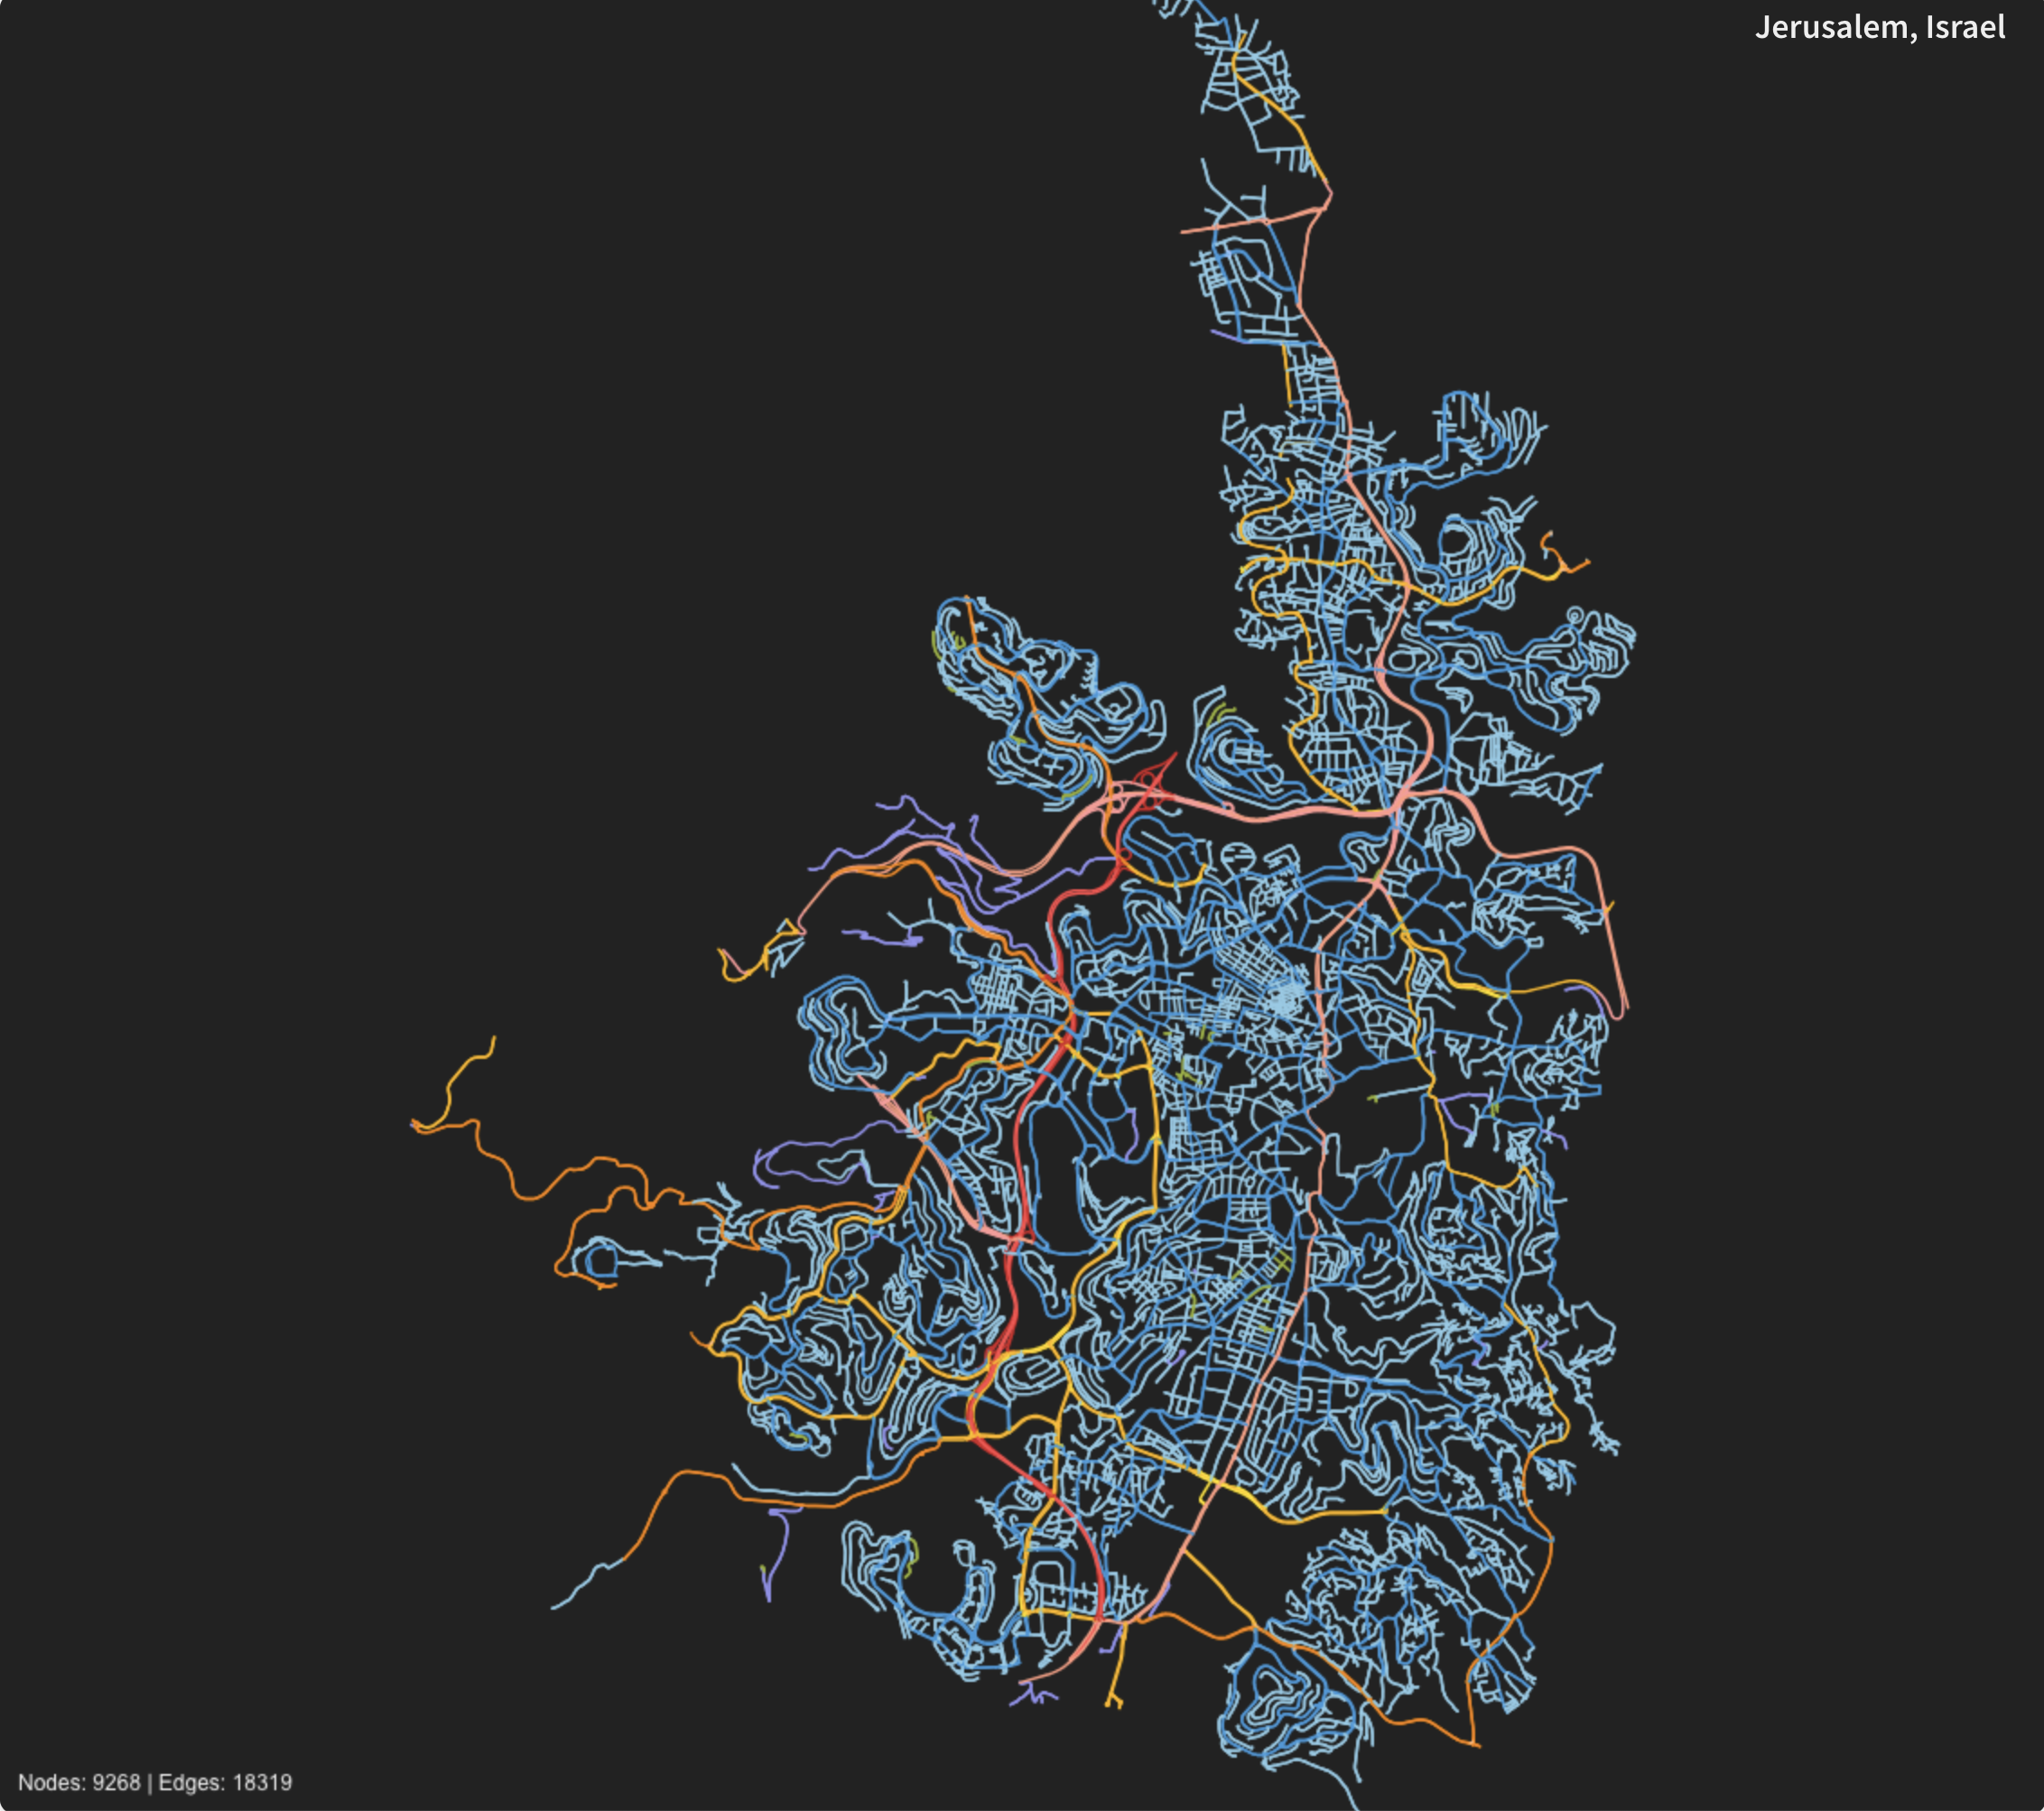
Jerusalem, Israel – A complex, winding network shaped by topography, where curving arterial routes and irregular local streets create a highly connected but visually tangled graph, reflecting adaptation to hills and valleys.
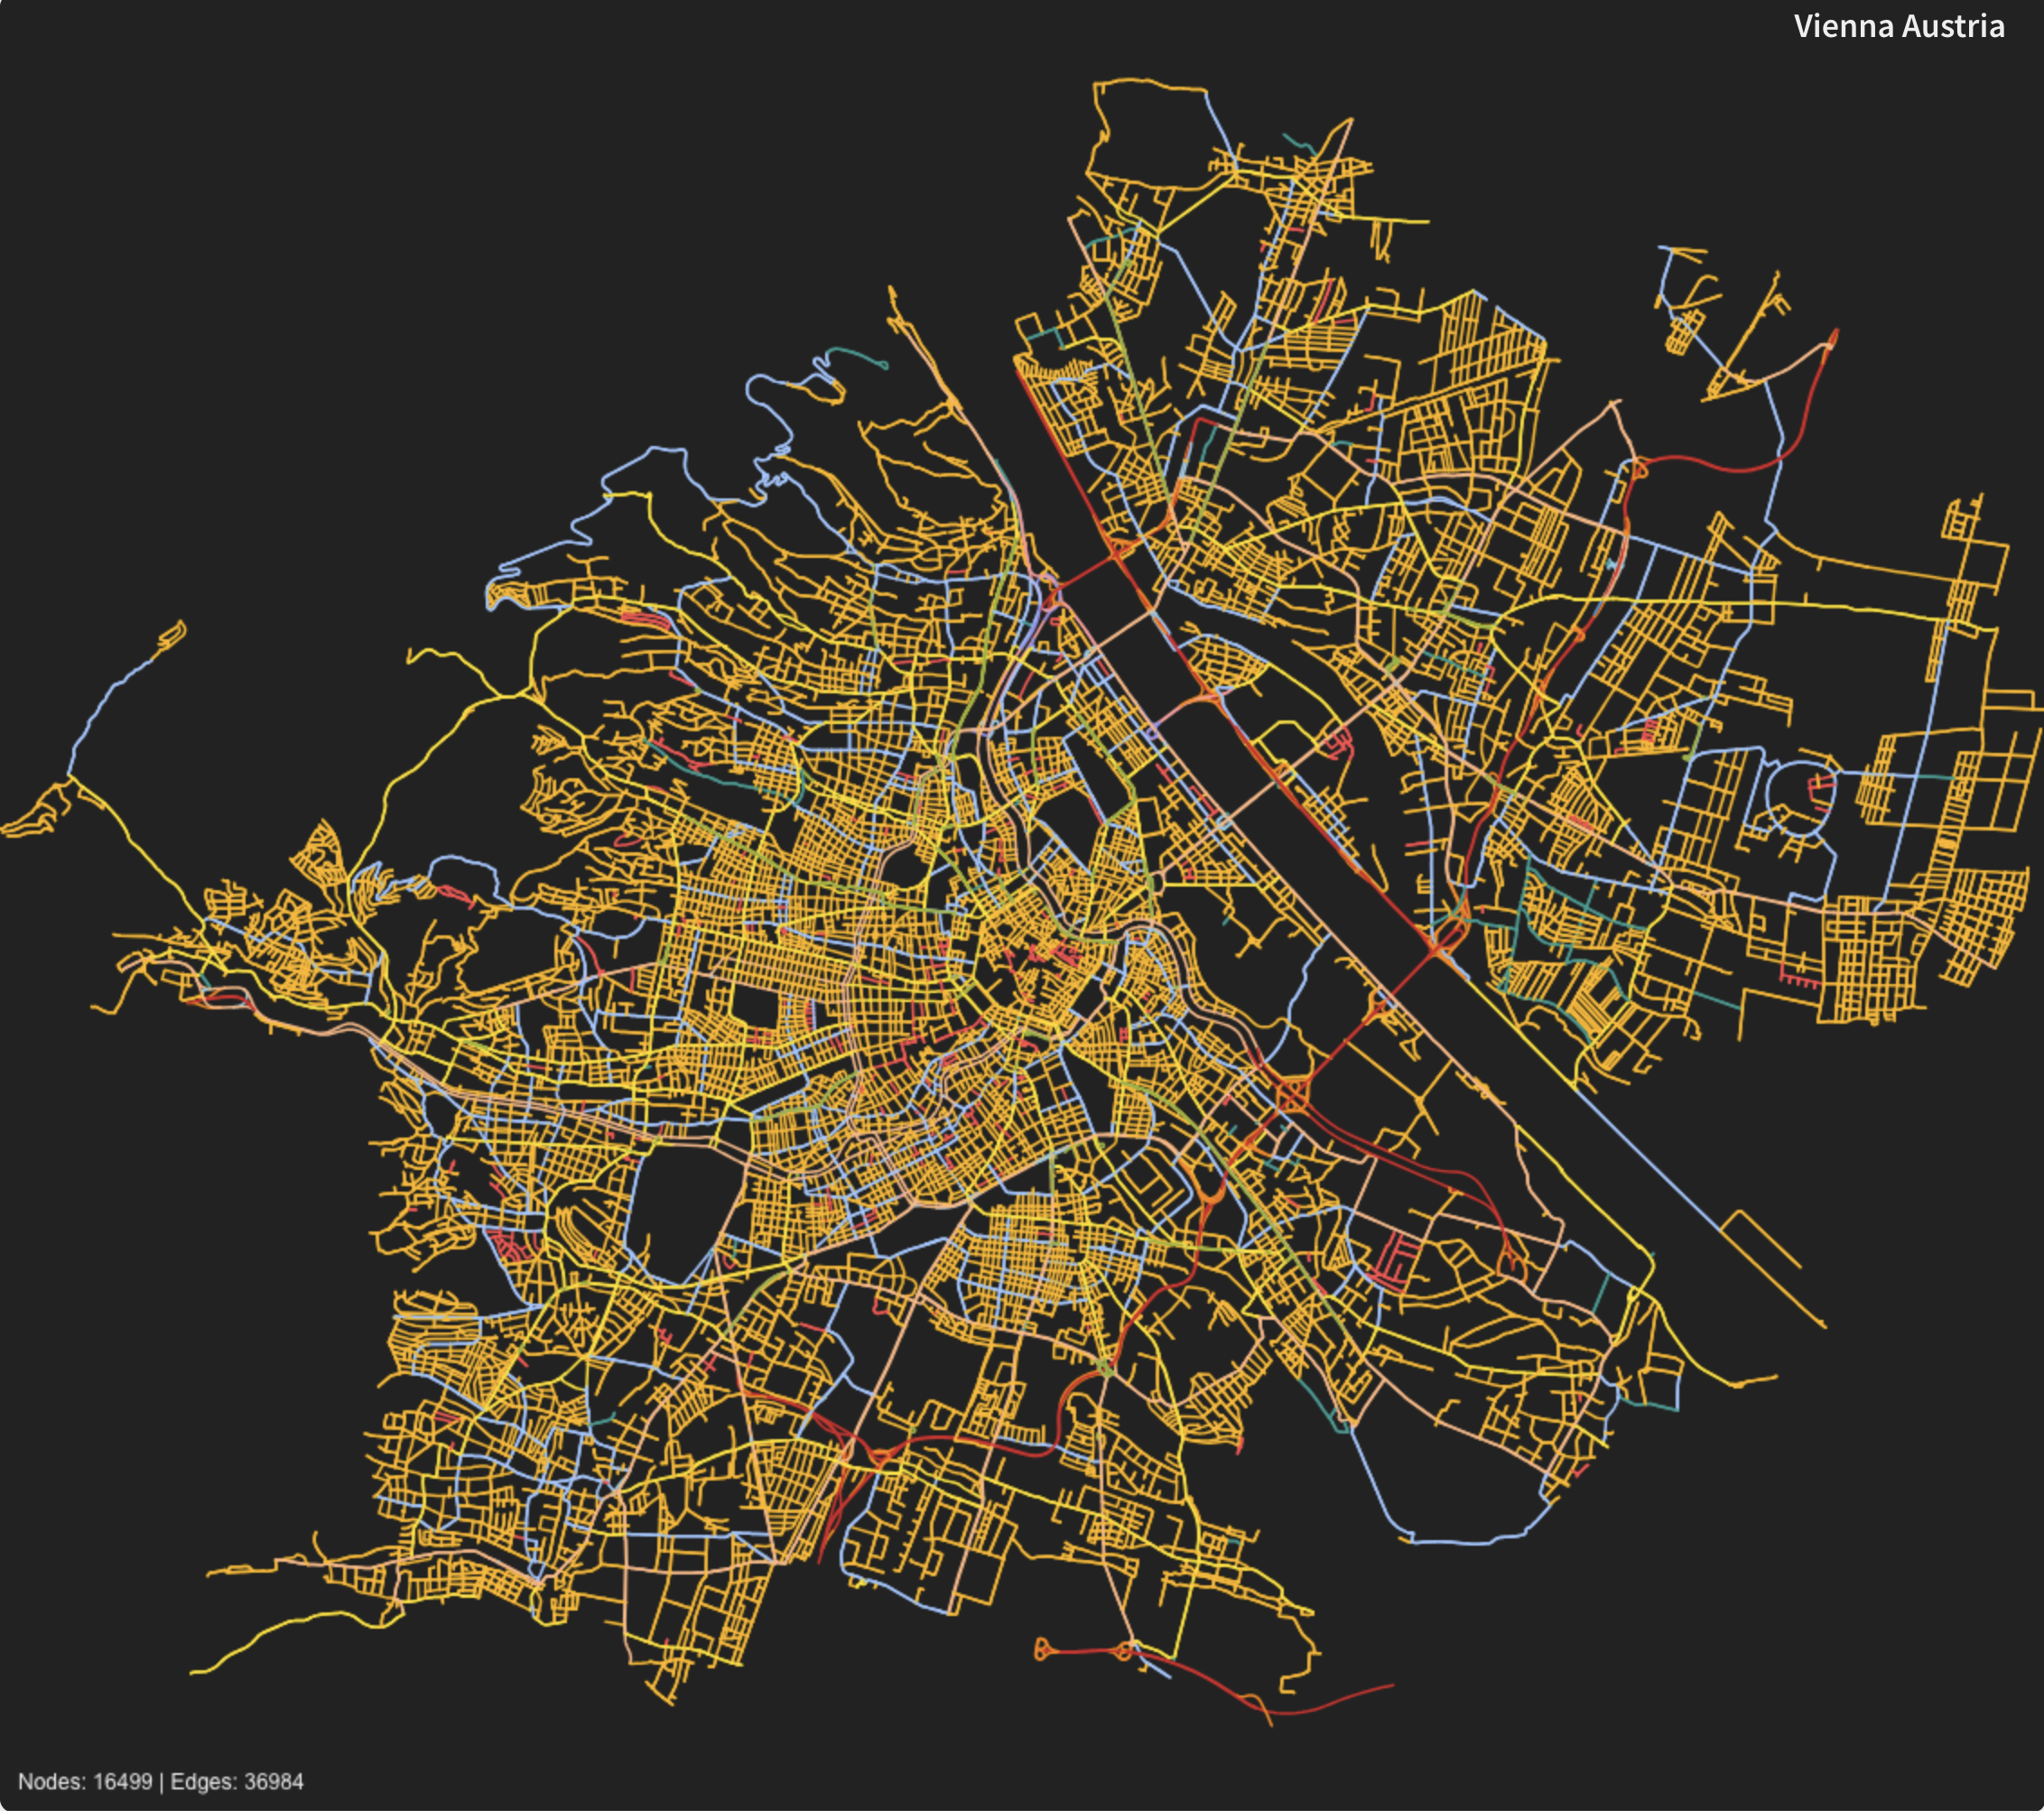
Vienna, Austria – A dense, highly interconnected web of streets with strong grid-like patterns near the center and layered rings of connectivity, illustrating a robust, multi-scale network with many alternative paths.

Montepulciano, Italy – A sparse, branching network where a compact historic core feeds into a small number of arterial spines and many dead-end rural roads, emphasizing a tree-like, low-redundancy topology.
Semantic zooming in this project is used to reveal different aspects of street-network topology as scale changes, rather than simply magnifying geometry. At distant zoom levels, the visualization emphasizes the global structure of the network—major arterials, backbone corridors, and overall connectivity patterns—allowing cities to be compared by their macroscopic organization and redundancy. As the viewer zooms in, finer-grained elements such as secondary streets, local intersections, and dead ends gradually emerge, exposing local connectivity, branching behavior, and neighborhood-scale structure. This multi-scale approach supports reasoning about how global circulation frameworks relate to local accessibility, making it possible to explore street networks as layered graphs whose meaning evolves continuously with scale.